Prices and Wages in the Ottoman Empire, 1469-1914
From Marteau
| Revision as of 14:22, 18 March 2008 Åževket Pamuk (Talk | contribs) ← Previous diff |
Revision as of 14:23, 18 March 2008 Åževket Pamuk (Talk | contribs) Database Next diff → |
||
| Line 69: | Line 69: | ||
| * S. Ozmucur/ Şevket Pamuk, "Urban Real Wages and the Standards of Living in the Ottoman Empire, 1469-1914" ''The Journal of Economic History'', June 2002. | * S. Ozmucur/ Şevket Pamuk, "Urban Real Wages and the Standards of Living in the Ottoman Empire, 1469-1914" ''The Journal of Economic History'', June 2002. | ||
| - | ==Database== | + | ==Database: Trends in Prices and Wages in Istanbul, 1469-1914 (decennial averages)== |
| - | ===Trends in Prices and Wages in Istanbul, 1469-1914 (decennial averages)=== | + | |
| <center> | <center> | ||
Revision as of 14:23, 18 March 2008
Contents |
Part I: The Development of Prices
This study on prices has utilized data on the prices of standard commodities (food and non-food items) collected from more than six thousand account books and price lists located in the Ottoman archives in Istanbul. In the first stage of the study, food price indices were constructed based on the account books and prices paid by the many pious foundations, both large and small, and their soup kitchens (imaret).
To the extent possible, standard commodities have been used in the construction of these indices in order to minimize the effects of quality changes. Each of the three food indices includes the prices of ten to twelve leading items of consumption, namely flour, rice, honey, cooking oil, mutton, chick peas, lentils, onions, eggs, sugar (for the palace only), coffee (beginning in the seventeenth century for the palace and eighteenth century for the pious foundations) and olive oil for burning. Amongst these, flour, rice, cooking oil, mutton, olive oil and honey provided the most reliable long term series and carried the highest weights in our food budget. In cases where the prices of one or more of these items were not available for a given year, the missing values were estimated by an algorithm that applied regression techniques to the available values.
Based on the available evidence regarding the budget of an average urban consumer, the weight of food items in the overall indices was fixed between 75 and 80 percent. The weight of each commodity in the overall index was then based on the shares of each in total expenditures of the respective institutions. To cite two prominent examples, in the absence of long series on bread prices, the weight of flour, mostly wheat flour, varies mostly between 32 and 40 percent of food expenditures and 24 to 32 percent of overall expenditures, depending on the fluctuations in prices. Similarly, the weight of meat (mutton) varies between 5 and 8 percent of the overall budget. It is likely that the diets of private households in the capital city differred from those offered by the soup kitchens. At this stage, however, it is not possible to approximate the private diets more closely.
In the second stage, prices of non-food items obtained from a variety of sources, most importantly the palace account books, were added to the indices. These commodities are soap, wood, coal, nails by weight (used in construction and repairs). From the various account books of the imperial palace, it is possible to obtain long term price series on two types of woolen cloth, the locally produced çuha and the çuha Londrine imported from England. Both the absolute level and long term trends in the more reliable woolen cloth prices suggest, however, that these were not the varieties worn by ordinary people but expensive types of cloth purchased by high income groups. Since increases in the prices of these woolen varieties lagged far behind the overall index, cloth prices were not included in the overall index until 1860. Price data for a large number of other types of cloth have also been collected but none of these are available for long periods of time. A cost of living index should also include rental cost of housing but an adequate series for standard housing is not available at this stage.
For the period 1860 to 1914, data from the above sources are very limited. For this reason, the detailed quarterly wholesale prices of the Commodity Exchange of Istanbul covering about two dozen commodities were used. Indices based on these prices were then linked to those covering the earlier period.
Istanbul was chosen primarily because the data was most detailed for the capital city. However, price data from the account books of the pious foundations is available for other cities of the empire. Price observations from a shorter list of commodities was used to construct separate indices for the cities of Edirne, Bursa and Damascus. These indices indicate clearly that prices in other Ottoman cities moved together with those in Istanbul for the period for which comparable data is available. In these cities, both the overall change in the price level from 1490 to 1860 and the two major jumps in the price level that occurred late in the sixteenth and early in the nineteenth century were broadly comparable to the price trends in Istanbul. In addition, detailed price series gathered by Andre Raymond for 17th and especially 18th century Cairo indicate that, even though the monetary units were not identical, prices expressed in grams of silver showed similar trends in Istanbul and Cairo.
We thus obtained for the first time for the Middle East, in fact for the first time for anywhere in the non-European world, detailed and reliable price series for these four and a half centuries. For Istanbul, the results have been extended from 1914 to the present since published data on consumer prices is readily available for the recent period.
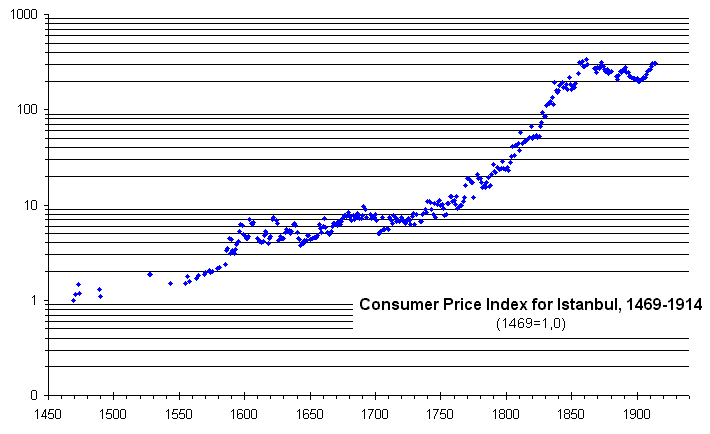
Graph 1 shows the annual values of the overall price index that combines the food prices obtained from the account books of pious foundations with the prices of non-food items. The vertical axis is given in log scale so that the slope of the line indicates the rate of change of nominal prices. These results indicate that prices increased by a total of about 300 times from 1469 until World War I. This overall increase corresponds to an average increase of 1.3 percent per year for the entire period.

The indices show that Istanbul experienced a significant wave of inflation from the late sixteenth and to the middle of the seventeenth century when the prices increased by about five fold. This is the period usually associated with the Price Revolution of the sixteenth century. The indices also show, however, that there occurred a much stronger wave of inflation beginning late in the eighteenth century and lasting into the 1850's when the prices increased by 12 to 15 times. Most of the latter increases were associated with the debasements that began in the 1780's and accelerated during the reign of Mahmud II (1808-1839). In contrast, the overall price level was relatively stable from 1650 to 1780 and from 1860 until World War I.
Having established the basic trends in prices, we will briefly consider the causes of Ottoman inflation during these centuries. Obviously there were many causes of inflation during the early modern period as evidenced by the large literature and the extensive debates on the subject. From the long term perspective offerred by these price indices and our study of the Ottoman currency, however, there is strong evidence that debasements or the reduction of the specie content of coinage by the monetary authorities were the most important cause of Ottoman price increases.
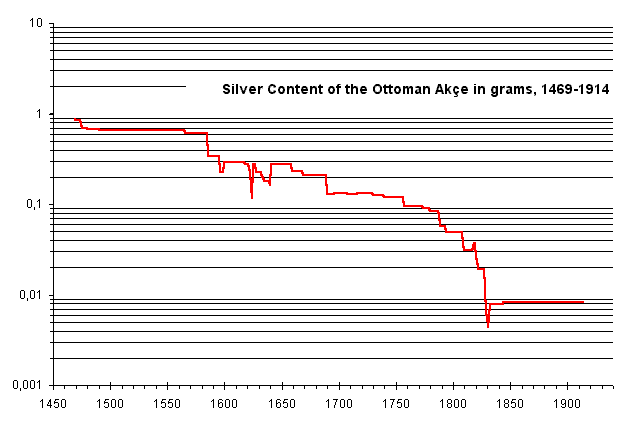
The relation between debasements and the price level can be established more closely by following the silver content of the Ottoman currency since 1450. Graph 2 presents the annual silver content of the akçe and later the kuruş (linked at 1 kuruş=120 akçes) based on an earlier study. The vertical axis is again in log scale so that the slope of the curve indicates the rate of debasement. Graph 2 shows that the silver content of the Ottoman currency declined most rapidly during the late sixteenth and early seventeenth centuries and also during the late eighteenth and early nineteenth centuries. In contrast, prices were relatively stable after 1860 when the silver content of the Ottoman currency remained unchanged.

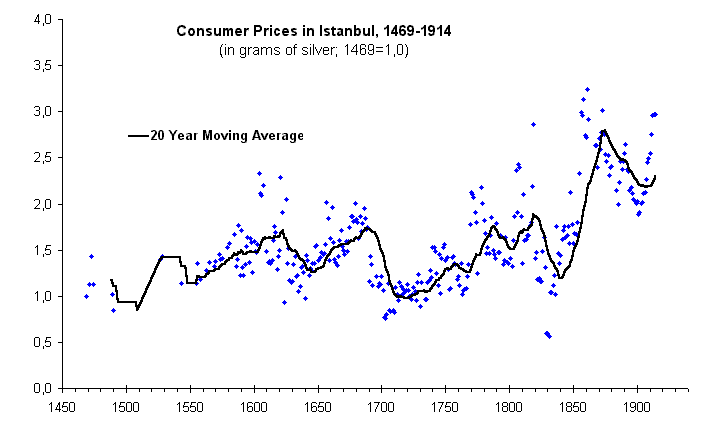
An alternative way to examine the relationship between debasements and the price level would be to construct price indices expressed in grams of silver which is obtained by multiplying the value of the price index by the silver content of the Ottoman currency for the same year. Graph 3 combines the evidence in the earlier two graphs and presents the overall price index for Istanbul in grams of silver. The series was extended beyond 1870 even though world silver prices declined sharply after that date, because the nominal value of silver coinage was not changed under the Ottoman monetary system until World War I.

It is remarkable that even though nominal prices in Istanbul increased by about 300 times, prices expressed in grams of silver stayed within the relatively narrow range of 1.0 to 3.0 during these four and a half centuries. There were medium term movements in prices expressed in grams of silver. They increased from 1500 until 1640, declined until the early decades of the eighteenth century, and increased again until the middle of the nineteenth century. All this, however, occurred around a long-term trend which was rising only modestly. In other words, debasements were the most important determinant of Ottoman prices in the long term. In the longer term, the so-called silver inflation also contributed to the changes in the overall price level but its impact paled in relation to that of debasements. (See Graphs 2 and 3)
Part II: Wages
In this second part of the study, daily wage data were gathered from several thousand account books of the construction and repair sites in Istanbul and other cities. These account books contain daily wages for both unskilled and a variety of skilled construction workers. Urban construction workers was a relatively homogeneous category of labor over time and space. Moreover, in contrast to the payments made to other employees, urban construction workers received a high proportion if not all of their pay in cash rather than in kind or in the form of shelter, food and clothing. As a result, their wages allow for useful inter-country comparisons between pre-industrial societies.
The construction account books prepared by the state or by pious foundations of varying size and utilized for the purposes of this study usually consisted of a series of attendance records listing the workman employed, craft of the worker, his rank (master, common laborer etc.) and the wages paid to each. Sometimes the accounts provide a separate record for each day; sometimes a few days or weeks are covered by a single attendance sheet. Many of the account books also included lists and prices of materials purchased such as iron, lime and nails the last of which was utilized in the construction of the price indices.
Information about the length of the workday is rare in these records. Similarly, information regarding whether food or lunch is provided along with the daily wage is usually not given. For that reason, we have chosen to ignore those aspects of the daily wage. We have also decided to ignore the seasonal variations in daily wages. In any case, the overwhelming majority of the available observations belong to the construction season (April through October in Istanbul).
The wages for unskilled workers referred mostly to one type of worker, called ýrgad in the early period and rençber after about 1700. In contrast, daily wage rates could be found in for more than half a dozen categories of skilled construction workers in these account books. In order to utilize the additional information, an index was constructed for skilled wages which included the wages of carpenters, masons, stonecutters, ditchdiggers, plasterers and others. Based on the relative frequency with which they appeared in the account books, the greatest weight in this index was given to the category of neccar, specialists who built wooden houses and the wooden parts of buildings. There also existed a separate category of carpenter (marangoz) which apparently referred more to makers of furniture. The share of neccar fluctuated between 50 to 60 percent in our skilled wage index.
It is not easy to judge at this stage to what extent daily wages were influenced by institutional factors and to what extent they were determined by market forces. However, the fact that during periods of rapid debasement real wages initially declined but adjusted upwards fairly quickly suggests that the process of wage formation was open to market forces.
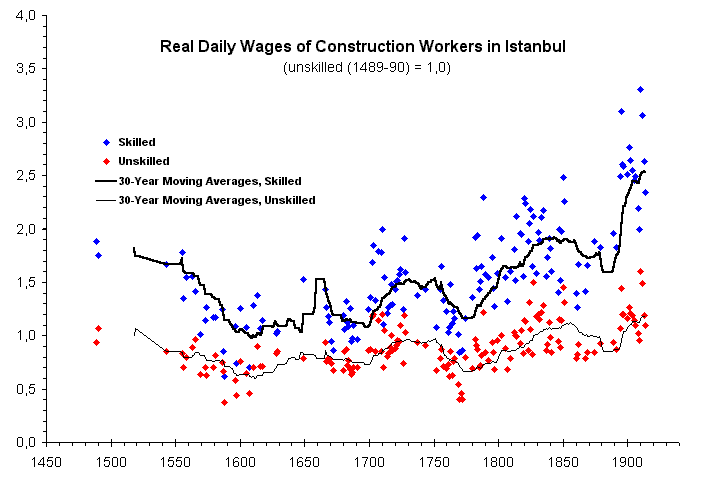
Graph 4 presents real daily wage series for skilled and unskilled construction workers obtained by deflating the nominal daily wage series by the consumer price index for the city of Istanbul. For both the skilled and unskilled real wage series in this graph, the base years 1489-90 are set at 1.0.

These indices indicate that real wages of unskilled construction workers in Istanbul declined by 30 to 40 percent during the sixteenth century. Population growth must have been the most important determinant of this trend. After remaining roughly unchanged until the middle of the eighteenth century, Istanbul real wages increased by about 30 percent from late eighteenth until mid-nineteenth century and then by another 40 percent during the late nineteenth and early twentieth century. On the eve of World War I, real wages of unskilled construction workers were about 20 percent above their levels in 1500. Because the skill premium rose during the nineteenth century, real wages of skilled workers stood at approximately 50 percent above their levels in 1500.
The purchasing power of the daily wages of both the skilled and unskilled workers were reasonably high during these four and a half centuries. During the sixteenth century, an unskilled construction worker could purchase with his daily wage 8 kilos of bread or 2.5 kilos of rice or more than 2 kilos of mutton. Daily wages of skilled workers were 1.5 to 2 times higher. At these levels of daily pay, skilled construction workers must have enjoyed standards of living well above the average for the population as a whole and also above the average of the urban areas even if they did not work for as many as 200 days per year.
Literature:
- Şevket Pamuk, "Prices in the Ottoman Empire, 1469-1914" International Journal of Middle East Studies, August 2004
- S. Ozmucur/ Şevket Pamuk, "Urban Real Wages and the Standards of Living in the Ottoman Empire, 1469-1914" The Journal of Economic History, June 2002.
Database: Trends in Prices and Wages in Istanbul, 1469-1914 (decennial averages)
| Years | Consumer Price Index, in Akçes, 1469=1,0 | Consumer Price Index in grams of silver. 1469=1.0 | Daily Wage of an Unskilled Worker. in Akçes | Daily Wage of a Skilled Worker. in Akçes | Daily Wage of an Unskilled Worker. in grams of silver | Daily Wage of an Skilled Worker. in grams of silver | Purchasing Power. Daily Wage of an Unskilled Worker (1489-1490=1.0) | Purchasing Power. Daily Wage of a Skilled Worker (1489-1490=1.0) |
| 1469-79 | 1.20 | 1.17 | n.a. | n.a. | n.a. | n.a. | n.a. | n.a. |
| 1480-89 | 1.30 | 1.02 | 4.9 | 9.8 | 3.3 | 6.6 | 0.93 | 1.04 |
| 1490-99 | 1.09 | 0.85 | 4.7 | 7.7 | 3.1 | 5.2 | 1.06 | 0.96 |
| 1540-49 | 1.60 | 1.00 | 5.3 | 9.6 | 3.5 | 6.3 | 0.86 | 0.92 |
| 1550-59 | 1.64 | 1.25 | 5.0 | 9.7 | 3.3 | 6.4 | 0.78 | 0.86 |
| 1560-69 | 1.86 | 1.32 | 5.9 | 9.3 | 3.8 | 6.0 | 0.83 | 0.73 |
| 1570-79 | 1.99 | 1.41 | 5.6 | 9.9 | 3.4 | 6.0 | 0.68 | 0.66 |
| 1580-89 | 3.35 | 1.47 | 8.1 | 12.4 | 3.5 | 5.4 | 0.65 | 0.53 |
| 1590-99 | 4.45 | 1.46 | 11.7 | 20.7 | 2.6 | 4.6 | 0.51 | 0.50 |
| 1600-09 | 5.43 | 1.81 | 13.9 | 22.5 | 4.0 | 6.5 | 0.62 | 0.56 |
| 1610-19 | 4.44 | 1.47 | 14.2 | 22.8 | 4.1 | 6.6 | 0.76 | 0.67 |
| 1620-29 | 5.56 | 1.54 | 15.0 | 18.3 | 3.4 | 4.1 | 0.84 | 0.57 |
| 1640-49 | 4.37 | 1.34 | 15.2 | 29.5 | 4.2 | 8.2 | 0.79 | 0.84 |
| 1660-69 | 5.82 | 1.56 | 19.5 | 29.9 | 4.4 | 6.8 | 0.81 | 0.69 |
| 1670-79 | 7.06 | 1.69 | 18.0 | 23.0 | 3.7 | 4.8 | 0.71 | 0.50 |
| 1680-89 | 7.46 | 1.79 | 21.8 | 33.4 | 4.5 | 6.9 | 0.73 | 0.62 |
| 1690-99 | 7.96 | 1.21 | 26.2 | 36.9 | 3.4 | 4.8 | 0.78 | 0.61 |
| 1700-09 | 6.05 | 0.92 | 23.8 | 38.0 | 3.1 | 5.0 | 1.02 | 0.90 |
| 1710-19 | 6.87 | 1.03 | 25.2 | 38.2 | 3.3 | 5.0 | 0.92 | 0.77 |
| 1720-29 | 6.98 | 1.06 | 26.4 | 42.3 | 3.5 | 5.6 | 0.97 | 0.85 |
| 1730-39 | 7.62 | 1.10 | 30.6 | 44.8 | 3.8 | 5.6 | 0.94 | 0.76 |
| 1740-49 | 9.93 | 1.39 | 32.5 | 51.1 | 3.9 | 6.2 | 0.91 | 0.79 |
| 1750-59 | 10.1 | 1.30 | 32.4 | 58.6 | 3.6 | 6.6 | 0.76 | 0.75 |
| 1760-69 | 11.1 | 1.23 | 30.3 | 50.8 | 2.9 | 4.8 | 0.70 | 0.64 |
| 1770-79 | 17.8 | 1.93 | 38.7 | 71.2 | 3.6 | 6.7 | 0.52 | 0.51 |
| 1780-89 | 17.2 | 1.58 | 56.9 | 113.4 | 4.7 | 9.4 | 0.86 | 0.94 |
| 1790-99 | 24.5 | 1.50 | 80.2 | 148.4 | 4.1 | 7.7 | 0.84 | 0.84 |
| 1800-09 | 34.7 | 1.91 | 114.4 | 217.7 | 5.3 | 10.0 | 0.84 | 0.88 |
| 1810-19 | 49.5 | 1.86 | 202.6 | 401.2 | 6.9 | 13.7 | 0.95 | 1.04 |
| 1820-29 | 62.8 | 1.26 | 275.9 | 475.4 | 5.0 | 8.9 | 1.13 | 1.10 |
| 1830-39 | 130.1 | 1.12 | 608.8 | 1054 | 4.5 | 7.8 | 1.11 | 1.05 |
| 1840-49 | 181.0 | 1.70 | 717.2 | 1238 | 5.9 | 10.1 | 0.99 | 0.95 |
| 1850-59 | 240.5 | 2.32 | 935.3 | 1599 | 7.8 | 13.3 | 1.38 | 1.30 |
| 1860-69 | 285.7 | 2.76 | 964.7 | 1716 | 8.0 | 14.3 | 0.81 | 0.80 |
| 1870-79 | 265.6 | 2.56 | 941.4 | 1989 | 7.8 | 16.6 | 0.86 | 0.99 |
| 1880-89 | 238.1 | 2.30 | 944.0 | 2061 | 7.9 | 17.2 | 0.91 | 1.04 |
| 1890-99 | 235.6 | 2.27 | 1063 | 2308 | 8.9 | 19.2 | 1.12 | 1.35 |
| 1900-09 | 220.9 | 2.13 | 993.5 | 2150 | 8.3 | 17.9 | 1.10 | 1.31 |
| 1910-14 | 294.2 | 2.84 | 1861 | 3450 | 12.6 | 26.6 | 1.30 | 1.51 |
